

The $67,000 Mirage: Why Bitcoin’s Shadow Recovery is Hiding a Structural Deleveraging
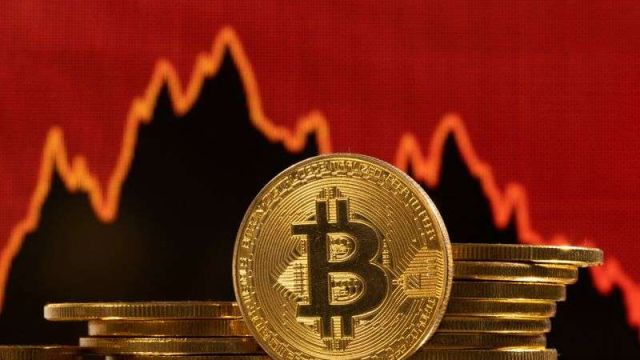
Bitcoin has once again defied the gravitational pull of a deteriorating macro environment, staging a rebound above the $67,000 threshold. To the retail observer, this 53% surge in trading volume climbing to $37.89 billion appears to be a signal of robust health and “buy-the-dip” conviction. Yet, for the institutional strategist, this price action feels less like a sustainable rally and more like a deceptive calm within a regime-conditional market.
The immediate recovery stands in stark contrast to a global economic outlook that remains decidedly clouded. UN Trade and Development (UNCTAD) has revised 2026 growth projections down to 2.7%, a significant retreat from the pre-pandemic average of 3.2%. This structural slowdown is exacerbated by fiscal strains and a persistent cost-of-living squeeze that threatens to lock the global economy into a low-growth path, making Bitcoin’s current stability a statistical anomaly rather than a leading indicator of recovery.
To navigate this landscape, one must look beneath the headline price to the five counter-intuitive takeaways currently defining the tape. From the “slow burn” of collapsing leverage to the brutal accounting insolvency of the mining sector, the data reveals a market in the midst of a silent, structural deleveraging. While Bitcoin remains “power-positive,” the path to becoming “accounting-positive” remains blocked by significant macro-financial hurdles.
The Deleveraging Floor: The “Slow Burn” Paradox
The current market is characterized by a fundamental shift in market velocity, driven by a collapse in derivatives leverage. Bitcoin open interest has plummeted from an early January peak of $37.67 billion to approximately $21.32 billion a staggering 43% reduction that has pushed leveraged participation toward six-month lows.
This lack of leverage creates a “slow-burn” environment rather than the vertical liquidations seen in previous cycles. As identified in recent sentiment data, the “absence of large pools of liquidations” means we are lacking the traditional “long squeeze” mechanics that accelerate market crashes. Furthermore, exchange inflows have dropped by 95% to just 2,879 BTC, indicating a total exhaustion of exit liquidity. While “inactive whales” provide a temporary price floor, they also signal a market in a holding pattern, lacking the “dry powder” necessary to sustain a breakout beyond immediate resistance.
The $114,000 Profitability Gap: The Hidden Struggle of Miners
While Bitcoin at $67,000 provides headline relief, a look at the “Bitcoin Mining Cost Model” reveals a sector in a state of accounting crisis. For major U.S. operators like Riot Platforms, the “cost to mine” is not a static figure but a three-layered break-even ladder:
- Electricity Break-Even ($64,635): The baseline cash cost to keep ASICs running.
- Operating Break-Even ($74,444): The threshold required to cover non-power operating expenses.
- Full Accounting Break-Even ($114,130): The only number that ensures long-term survival, accounting for corporate overhead and the three-year useful life of mining hardware.
The brutal reality is that at $67,000, firms like Riot are merely “power-positive” subsidizing their broader existence by burning through equity and Wall Street funding to stay alive. On an accounting basis, the industry is hemorrhaging cash, requiring Bitcoin to retest all-time highs above $114,000 before the sector can be considered truly profitable. Until then, miners are merely passengers in an AI-escape-hatch strategy, pivoting toward high-performance computing to avoid the crushing weight of cryptocurrency volatility.
The Geopolitical Pivot: Oil as the Ultimate Bitcoin Signal
Geopolitical developments have transitioned from background noise to the primary determinant of Bitcoin’s asymmetric downside vulnerability. The escalating conflict between the U.S., Israel, and Iran marked by President Trump’s rhetoric regarding an “unconditional surrender” from Tehran pushed Brent oil prices through an 18% surge toward $120 per barrel. While the G7’s discussion of a 400-million-barrel reserve release has provided temporary cooling, the inflation shadow remains long.
Bitcoin continues to behave as a high-beta risk asset, tethered to energy-driven inflation expectations. The Kobeissi Letter suggests that the current oil price reversal is one of the “biggest in history,” directly impacting the Federal Reserve’s path toward interest rate loosening.
“A Fed study found that every $10 increase in Oil prices could raise the Consumer Price Index (CPI) by 20 basis points.”
This persistent energy pressure forces Bitcoin into a defensive posture. As long as oil remains a weapon of geopolitical leverage, Bitcoin’s upside is capped by the looming threat of “higher-for-longer” monetary policy.
The Digital Gold Identity Crisis: Data vs. Narrative
An empirical study from the International Journal of Research in Management (2026) has decisively challenged the “digital gold” myth. Analyzing the post-ETF era, the study documents that Bitcoin’s correlation with the S&P 500 and the VIX has tripled since 2020, rising from a baseline of 0.10 to a structural level between 0.40 and 0.55.
The findings confirm that Bitcoin’s independence has been effectively “neutered” by institutionalization. The asset now exhibits a monotonically rising predictive power from equity sentiment and financial stability dynamics rather than acting as a reliable hedge. Hedging properties are strictly regime-conditional, emerging only during bull markets or extreme high-inflation spikes. In every other scenario, Bitcoin acts as a speculative proxy for global liquidity, permanently stripping it of its safe-haven credentials during periods of systemic stress.
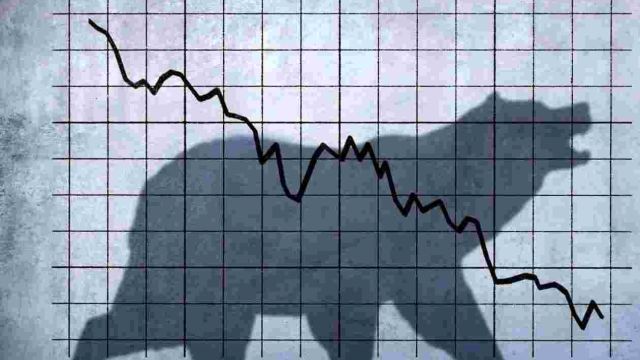
The 10% Technical Trap: The “Head-and-Shoulders” Warning
Despite the rebound above $67,000, the technical structure on the four-hour chart presents a classic “trap.” A clear head-and-shoulders formation remains valid, despite the market’s temporary reclaim of the $65,600 neckline. This reclaim has prevented an immediate breakdown, but it has not invalidated the bearish structure.
The “measured move” of this pattern points toward a target of $59,500 a 10% decline from current levels. Bitcoin is currently trapped in a “no-man’s-land” between critical support at $65,600 and the resistance zones at $68,800 and $70,800. Only a decisive daily close above $70,800 would invalidate this bearish trap; until then, the market remains highly susceptible to a grinding move lower as the “slow-burn” deleveraging continues.

Conclusion: The Slow Road to 2028
As we approach the 2028 halving, the market is realizing that institutional maturity comes with a high price. While Bitcoin is currently “power-positive” meaning the machines earn more than their electricity bills the infrastructure securing the network is not yet “accounting-positive.” The industry is effectively treading water, waiting for a price regime that may not arrive without a massive shift in global liquidity.
The institutionalization of Bitcoin via ETFs has successfully tethered the asset to the volatility of traditional macro-financial cycles. We are no longer observing a revolutionary, independent alternative, but a passenger in a global financial storm. This leaves the sophisticated investor with a vital question: Has the “ETF era” permanently capped Bitcoin’s potential by making it a permanent hostage to the Federal Reserve and the oil market?
In the 2026 macro-regime, Bitcoin has traded its revolutionary independence for institutional liquidity a Faustian bargain that makes it a passenger, not a pilot, in the global financial storm.


Leave a Reply