

The Great Disconnect: Why Global Markets are Defying Gravity (and What Happens Next)
1. Introduction: The Shoreline Before the Storm
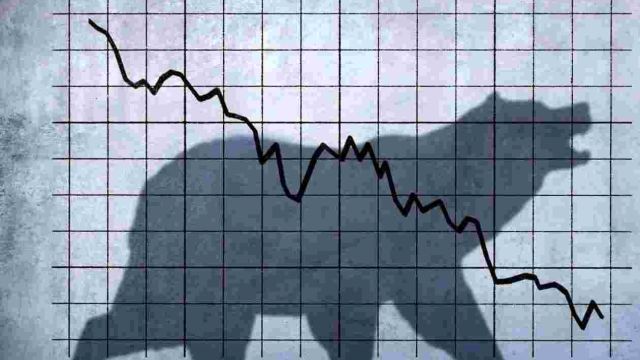
Imagine standing on a quiet shoreline just before a storm. The air is warm and the sky appears calm, yet an invisible pressure is building in the atmosphere a tension detectable only to the most attentive observers. This is the precise state of the global financial markets in early 2026. To the casual eye, the world looks prosperous; markets hover at record highs and portfolios are flush. Yet beneath this surface sits a distorted financial system propped up by intervention.
We are currently navigating a historic disconnect between economic reality and financial valuations. The relatable problem for every investor is that while the indices march upward, every major historical indicator suggests we should have already seen a correction. This post distills five critical, counter-intuitive takeaways from recent market signals from technical omens to geopolitical shifts that you must understand to navigate the closing of this cycle’s “denial phase.”
2. The Buffett Indicator: A Multi-Sigma Outlier at 224%
One of the most reliable barometers of market temperature is the Buffett Indicator the ratio of Total Market Cap to GDP. Historically, this indicator averages between 80% and 100%. When it crosses the 150% threshold, a crash typically follows, as seen before the dot-com collapse.
As of April 2026, the Buffett Indicator has reached a staggering 224.1%. This is a multi-sigma outlier that dwarfs the peaks of 1929, 2000, and 2008. This reading is not merely “expensive”; it is an unprecedented deviation from the mean. Based on these valuations, the market is positioned for a predicted -0.6% annual return for the next eight years. Even the “Modified Version,” which includes Federal Reserve assets in the denominator to account for record liquidity (resulting in a 184.9% reading), still labels the market as “Significantly Overvalued.” As Warren Buffett famously observed:
“Interest rates act on financial valuations the way gravity acts on matter: The higher the rate, the greater the downward pull.”
3. The Hindenburg Omen: Decoding the “Split Market” Signal
While the headline indices appear robust, internal market breadth is flashing a “Split Market” warning. The Hindenburg Omen, developed by Jim Miekka as a technical refinement of the NYSE’s “Split Market Sell Signal,” has recently perked up with alarming frequency.
The mechanics of the Omen are specific: the market must be in an uptrend, but the number of new daily highs and new daily lows on the NYSE must both exceed 2.8% of the total advances and declines. In February 2026, we witnessed a cluster of three signals within just six trading days. On a six-month look-back basis, we have reached a total of eight signals a level that has historically preceded violent market tops. This “perking up” of new lows during a period of supposedly plentiful liquidity suggests internal fragility; the uptrend is being carried by fewer and fewer names while the floor begins to rot.
4. The Three Invisible Pillars Delaying the Reckoning
If the fundamentals are so detached, why hasn’t the collapse occurred? Three structural forces are artificially delaying the reckoning, making the eventual correction more violent:
- The Monetary Firehose: Through the “Cantillon effect,” new liquidity enters the system through institutions closest to the source. These asset owners see their portfolios surge before wage earners and savers feel the subsequent inflation, creating a temporary illusion of prosperity that is actually a wealth transfer.
- AI Concentration and Passive Loops: A reflexive spiral is in play where a handful of AI-driven mega-caps carry nearly half the weight of the S&P 500. This is reinforced by the $16 trillion now controlled by passive funds. These funds buy mechanically based on market weight, regardless of risk or fundamentals, creating a feedback loop where size begets more capital.
- Risk Migration to Shadow Banking: Following 2008, risk moved from regulated banks to a $200 trillion unregulated ecosystem of hedge funds and private credit. This shadow system acts as a shock absorber, hiding cracks in the credit markets from public view until they reach a systemic breaking point.
5. The Mathematics of Market Timing: Log-Normal Distributions and Asymmetric Probability
For those tempted to “time the top,” research from Monash University provides a sobering mathematical counter-argument. Because market returns are a multiplicative process, the resulting probability distribution is log-normal and asymmetric.
The “most probable” outcome of a market timing strategy the mode of the distribution is a below-median return. In practice, this means that even before accounting for the higher costs and taxes of active switching, market timing is mathematically more likely to lose than to win. This is reflected in the performance of prominent tactical asset allocation funds like Putnam Dynamic Asset Allocation Balanced (PABAX) and Conservative (PACAX). Despite their “above average” professional management, these funds have historically trailed the median returns of a simple, static 60:40 balanced fund. In the game of timing, the math is rigged against the participant.
6. Geopolitics and the Yield Curve: The 2026 Pivot Point
The broader macro landscape is currently hitting a pivot point as fears of recession transition into expectations of growth and inflation. This is most visible in the steepening of the US Treasury yield curve: the 10-year yield currently stands at 4.36%, while the 2-year yield is at 3.86%. This 0.50% positive spread marks a departure from a prolonged inversion a signal that has preceded the last seven U.S. downturns.
This shift is being accelerated by the “Hormuz Factor.” Signals of a potential U.S.-Iran peace agreement and the reopening of the Strait of Hormuz have caused WTI crude oil to plummet to near 82 per barrel, easing short-term inflation fears and driving gold toward the 5,000 mark. However, this volatility is occurring against a backdrop of military tension:
“The U.S. Defense Secretary stated that the new operation would ‘maximize economic pressure on Iran’ and that combat operations could be resumed at any time if Iran refuses to reach an agreement.”
7. Conclusion: The Cleansing Power of the Cycle
The denial phase is nearing its end. Market cycles are ultimately mathematical and indifferent to human optimism. The 18-year land cycle points directly to the 2024–2026 window as a historically significant pivot point, where the exhaustion of debt and the resolution of geopolitical “Economic Fury” typically trigger a transition from euphoria to reality.
While market crashes are destructive, they are also “cleansing” resets that clear out excess and reset valuations to sustainable levels. These are the moments where generational wealth is created not by betting against gravity, but by being positioned for when it inevitably reasserts itself.
If the pillars holding up the current market shift tomorrow, are you positioned for the fall, or are you still betting against gravity?


Leave a Reply